
The EasyFrame Ecosystem
and how it all works
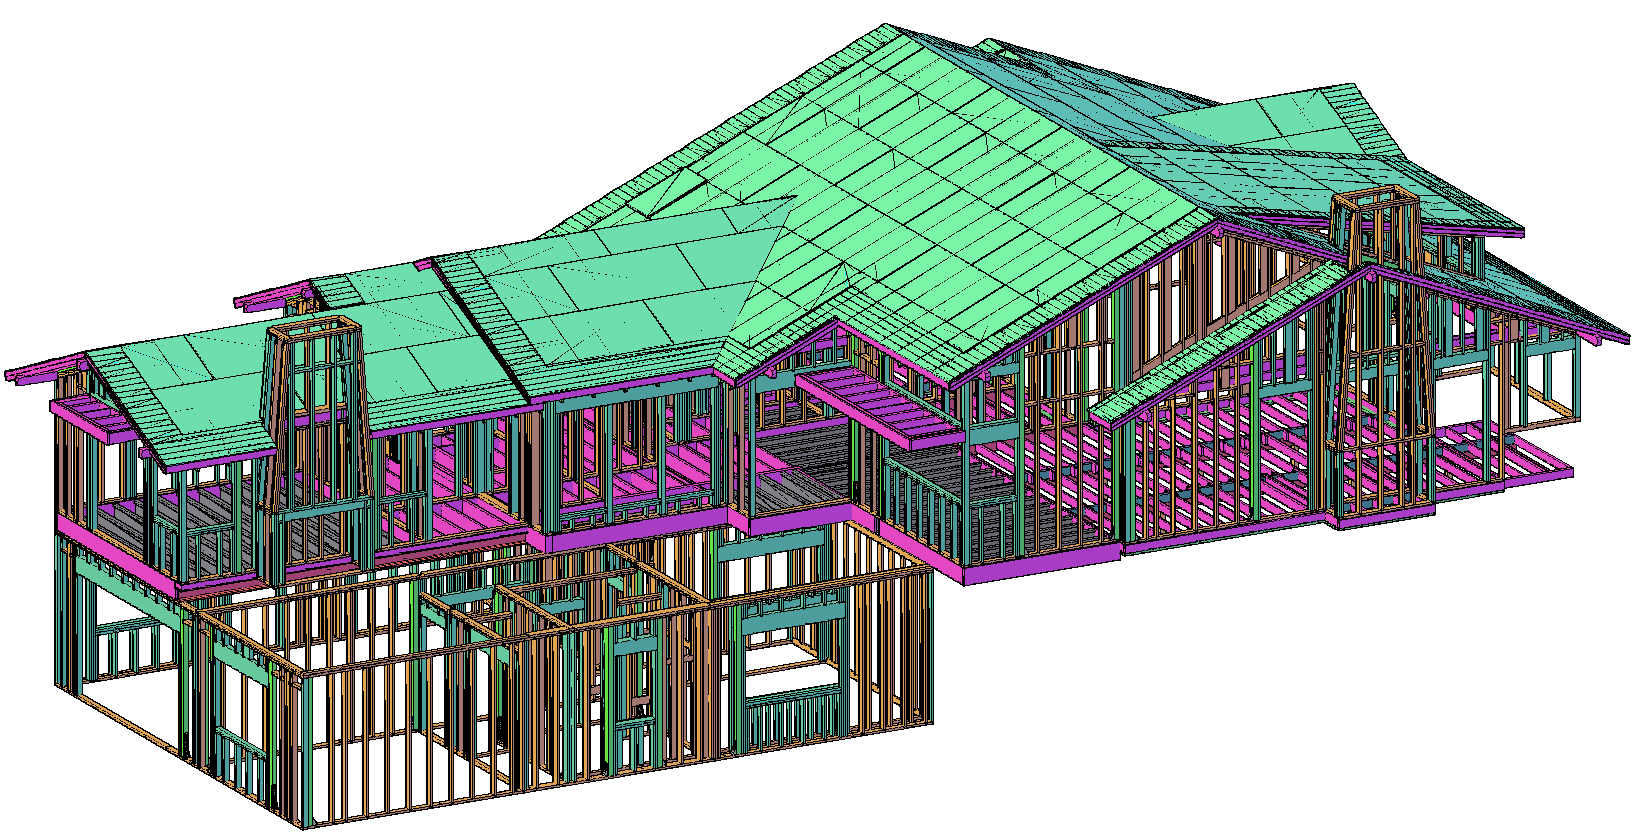
It all starts with design
The EasyFrame System is the most compatible piece of machinery of its kind. Just choose your 3D house design platform of choice and you’ll be set to use any of our products.
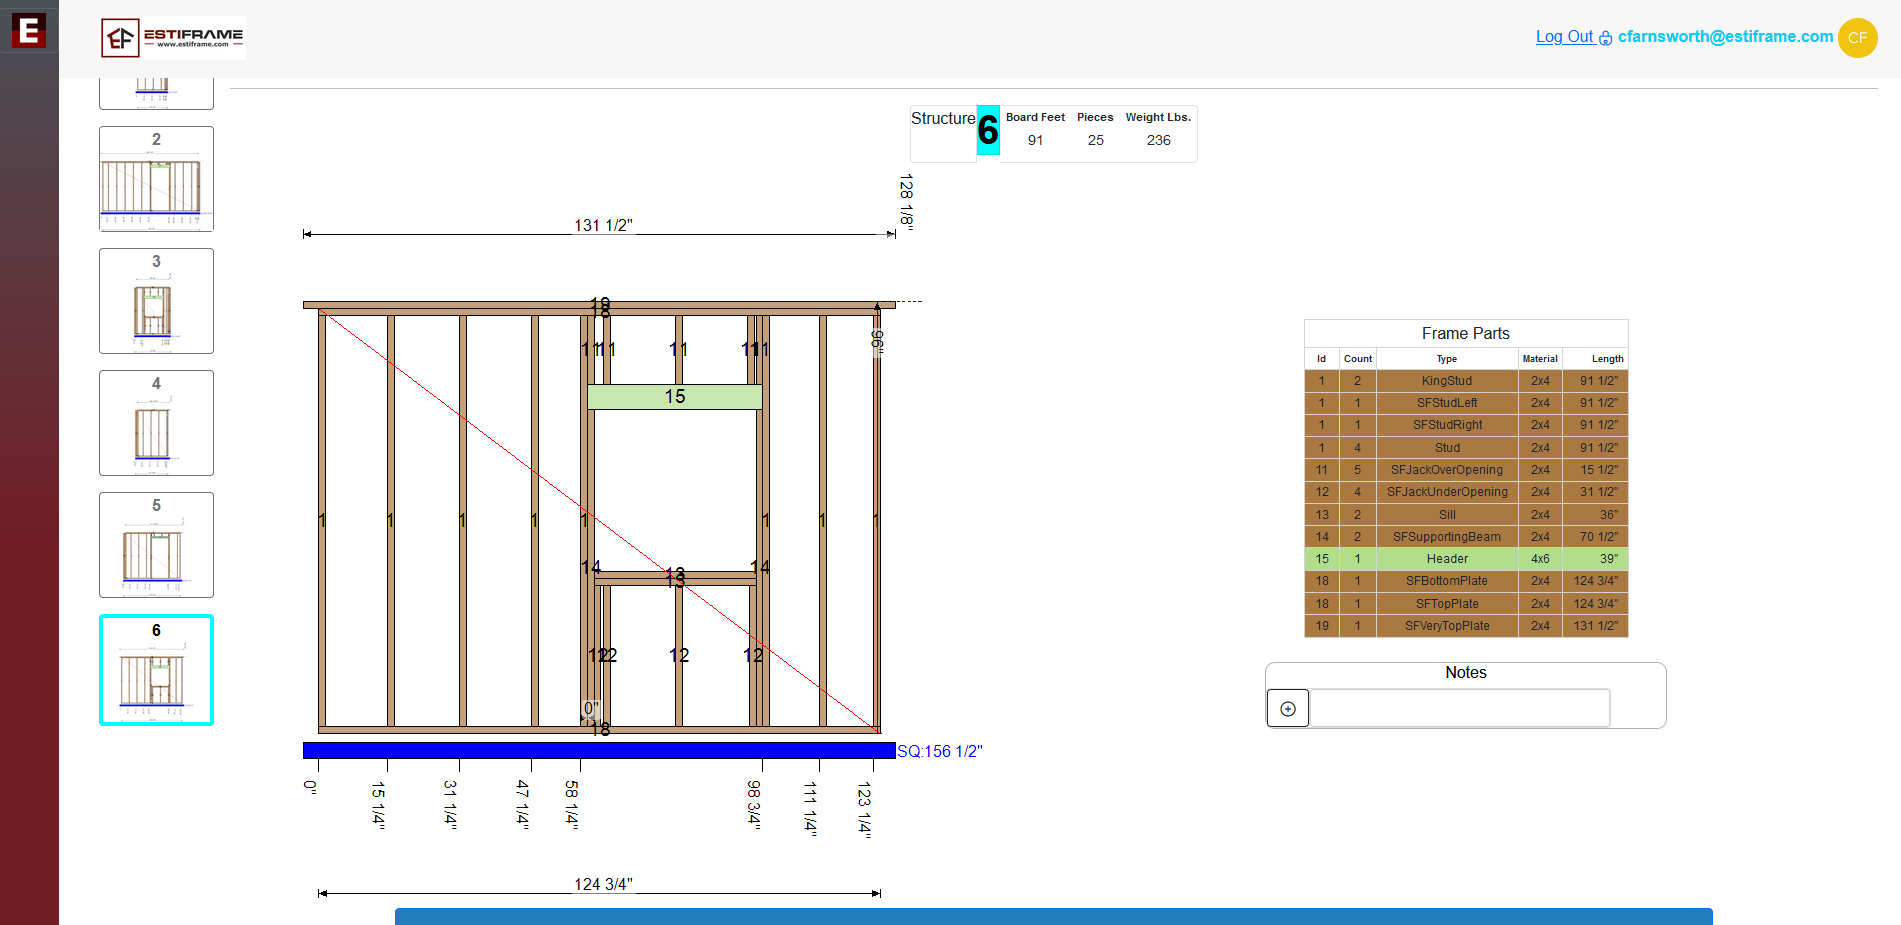
The Wall Framing Services team designs wall panels on the received architectural and structural drawings consisting of wall panel elevations, floor plan views, panel stack drawings, material reports, saw output files, and more!
Our seasoned team designs in Vertex BD, hsbcad, Autodesk Revit®, and AGACAD. With our extensive experience in on boarding customers onto these solutions, we can customize the environment to your specific needs by using our setup and templates as a starting point.
The EasyFrame Saw System can receive information from the listed software shown below.


And More!
The EasyFrame Cloud
(Optional)
Once your house has been deigned, we can send it to the EasyFrame Cloud. The EasyFrame Cloud allows you to manage prefab production from your phone, tablet, and computer simultaneously. Sending individual parts to saw stations can all be automated based on how your shop works.


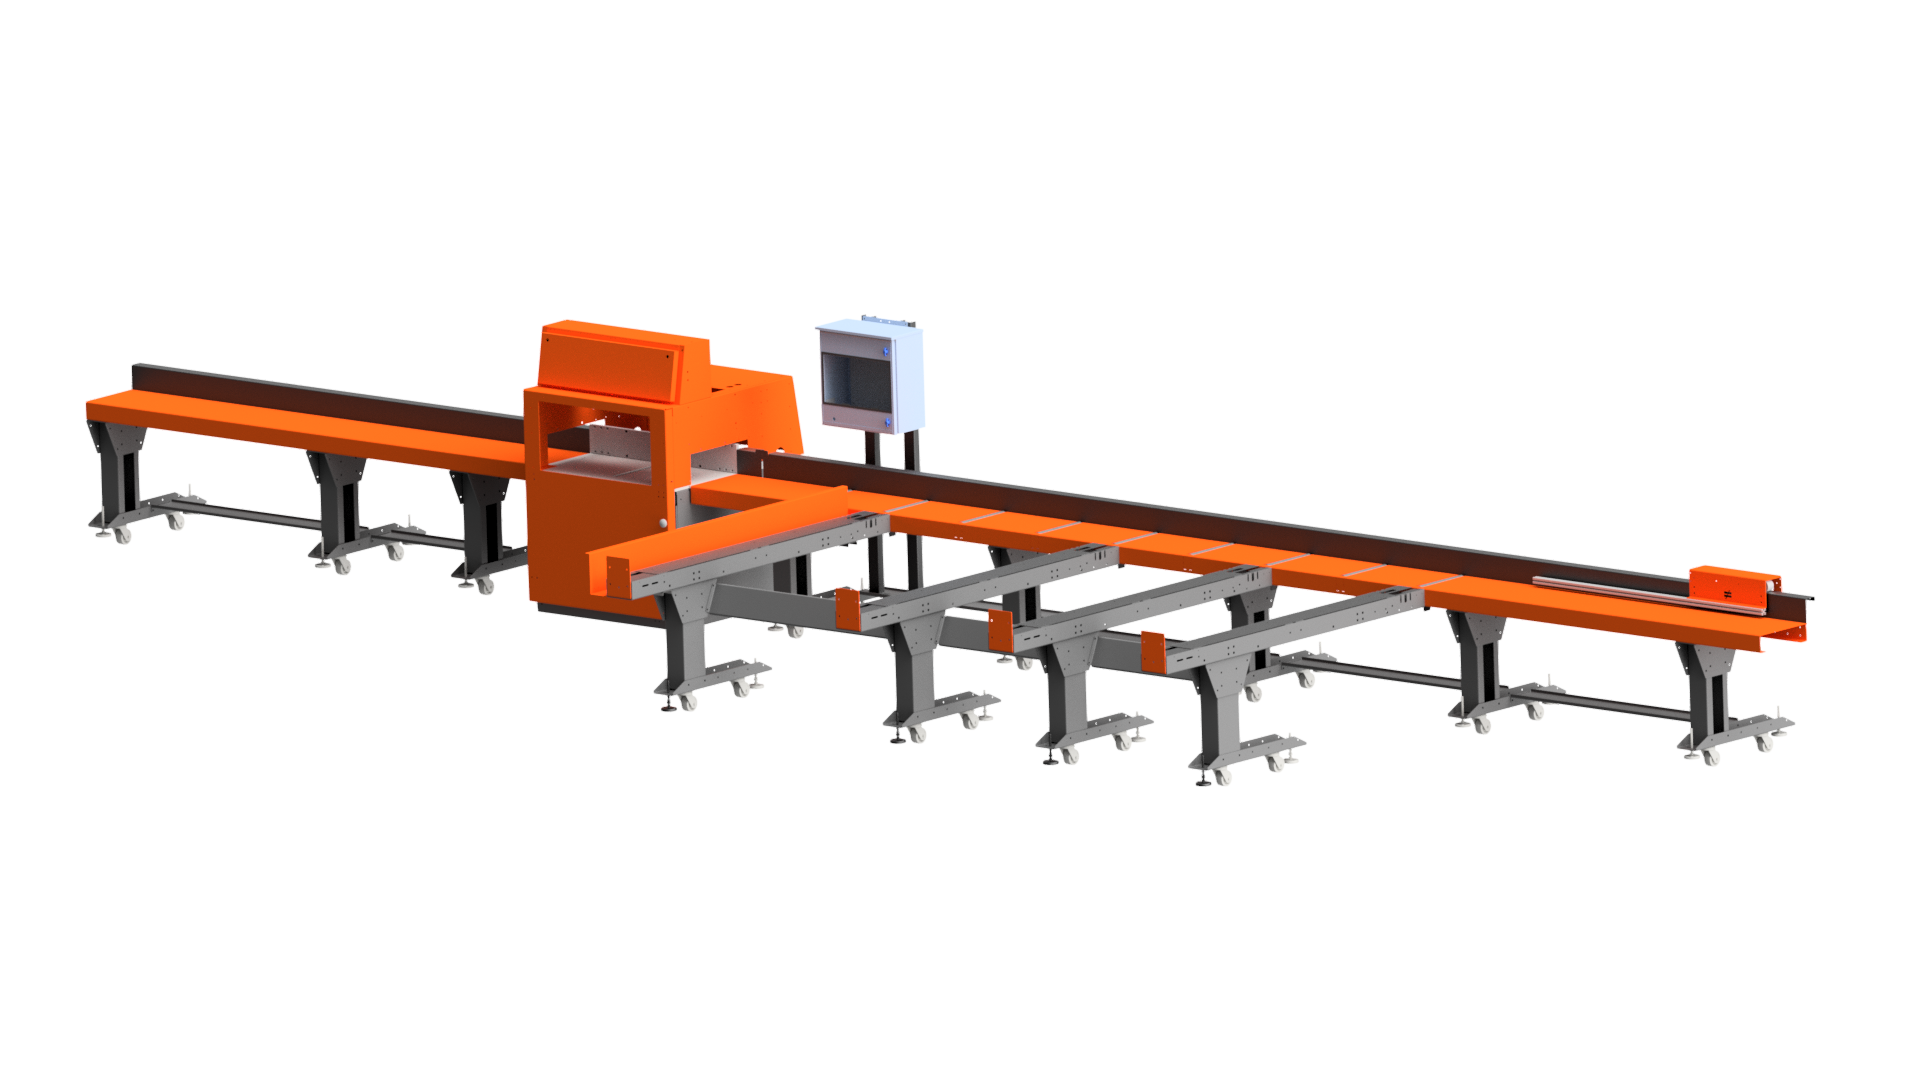
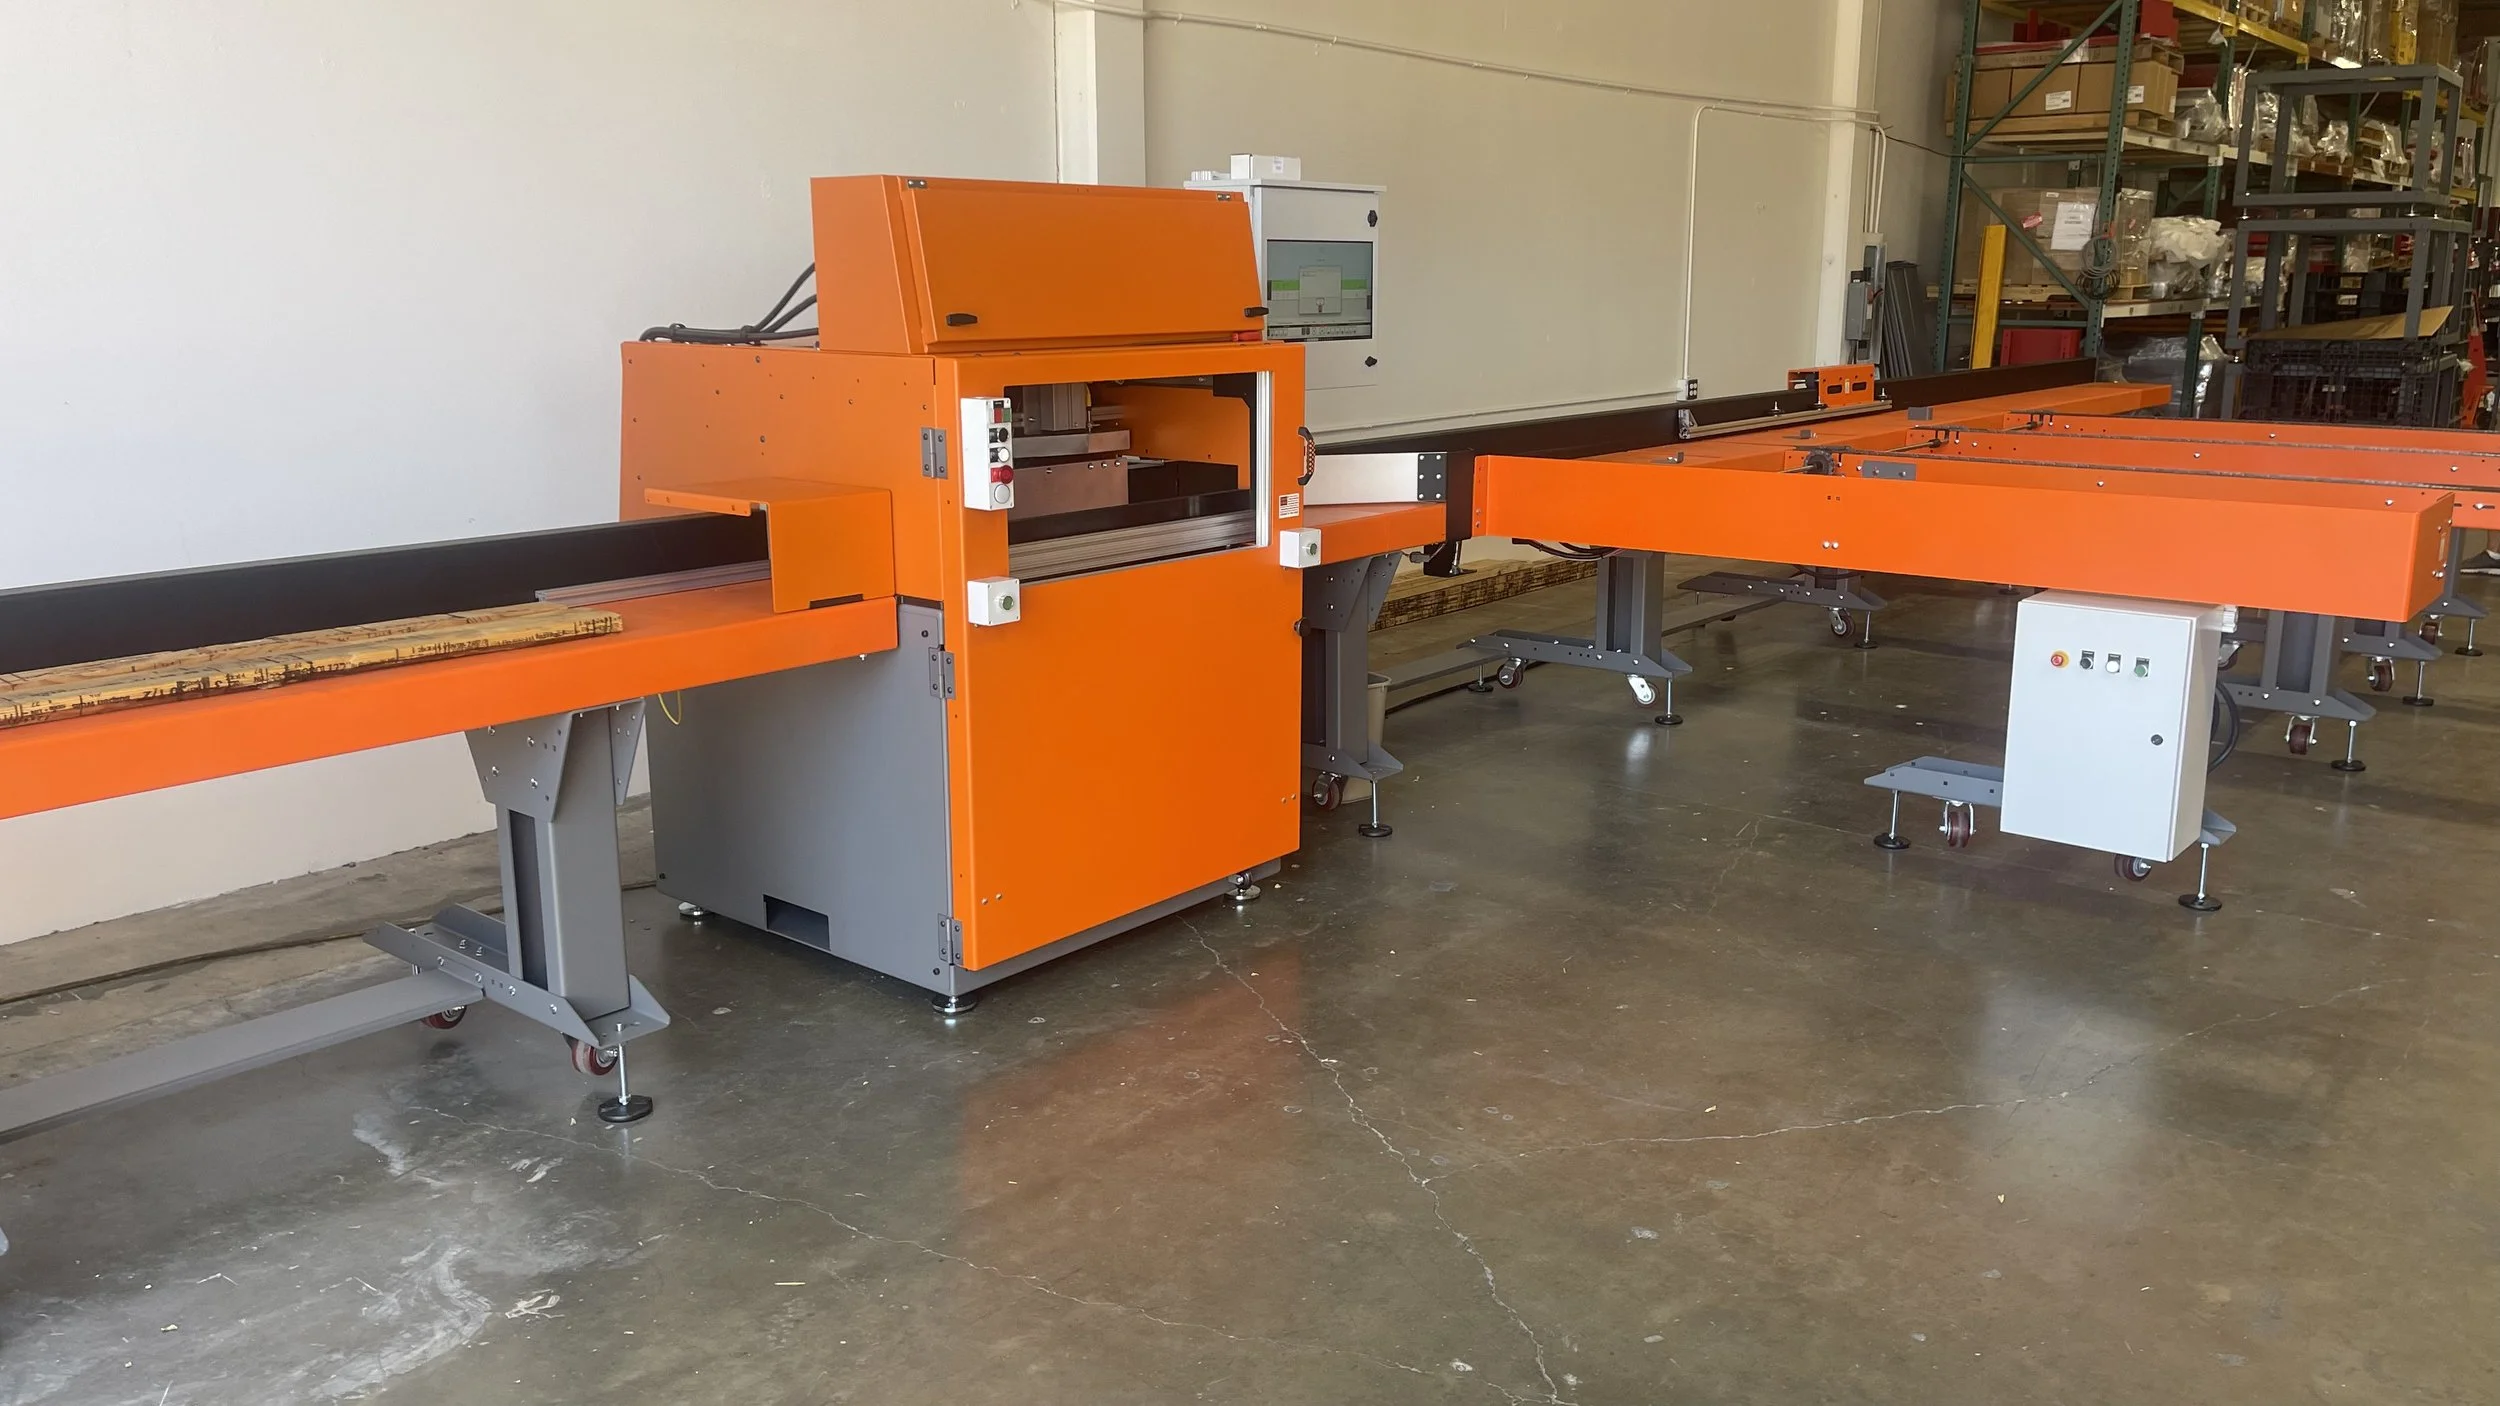
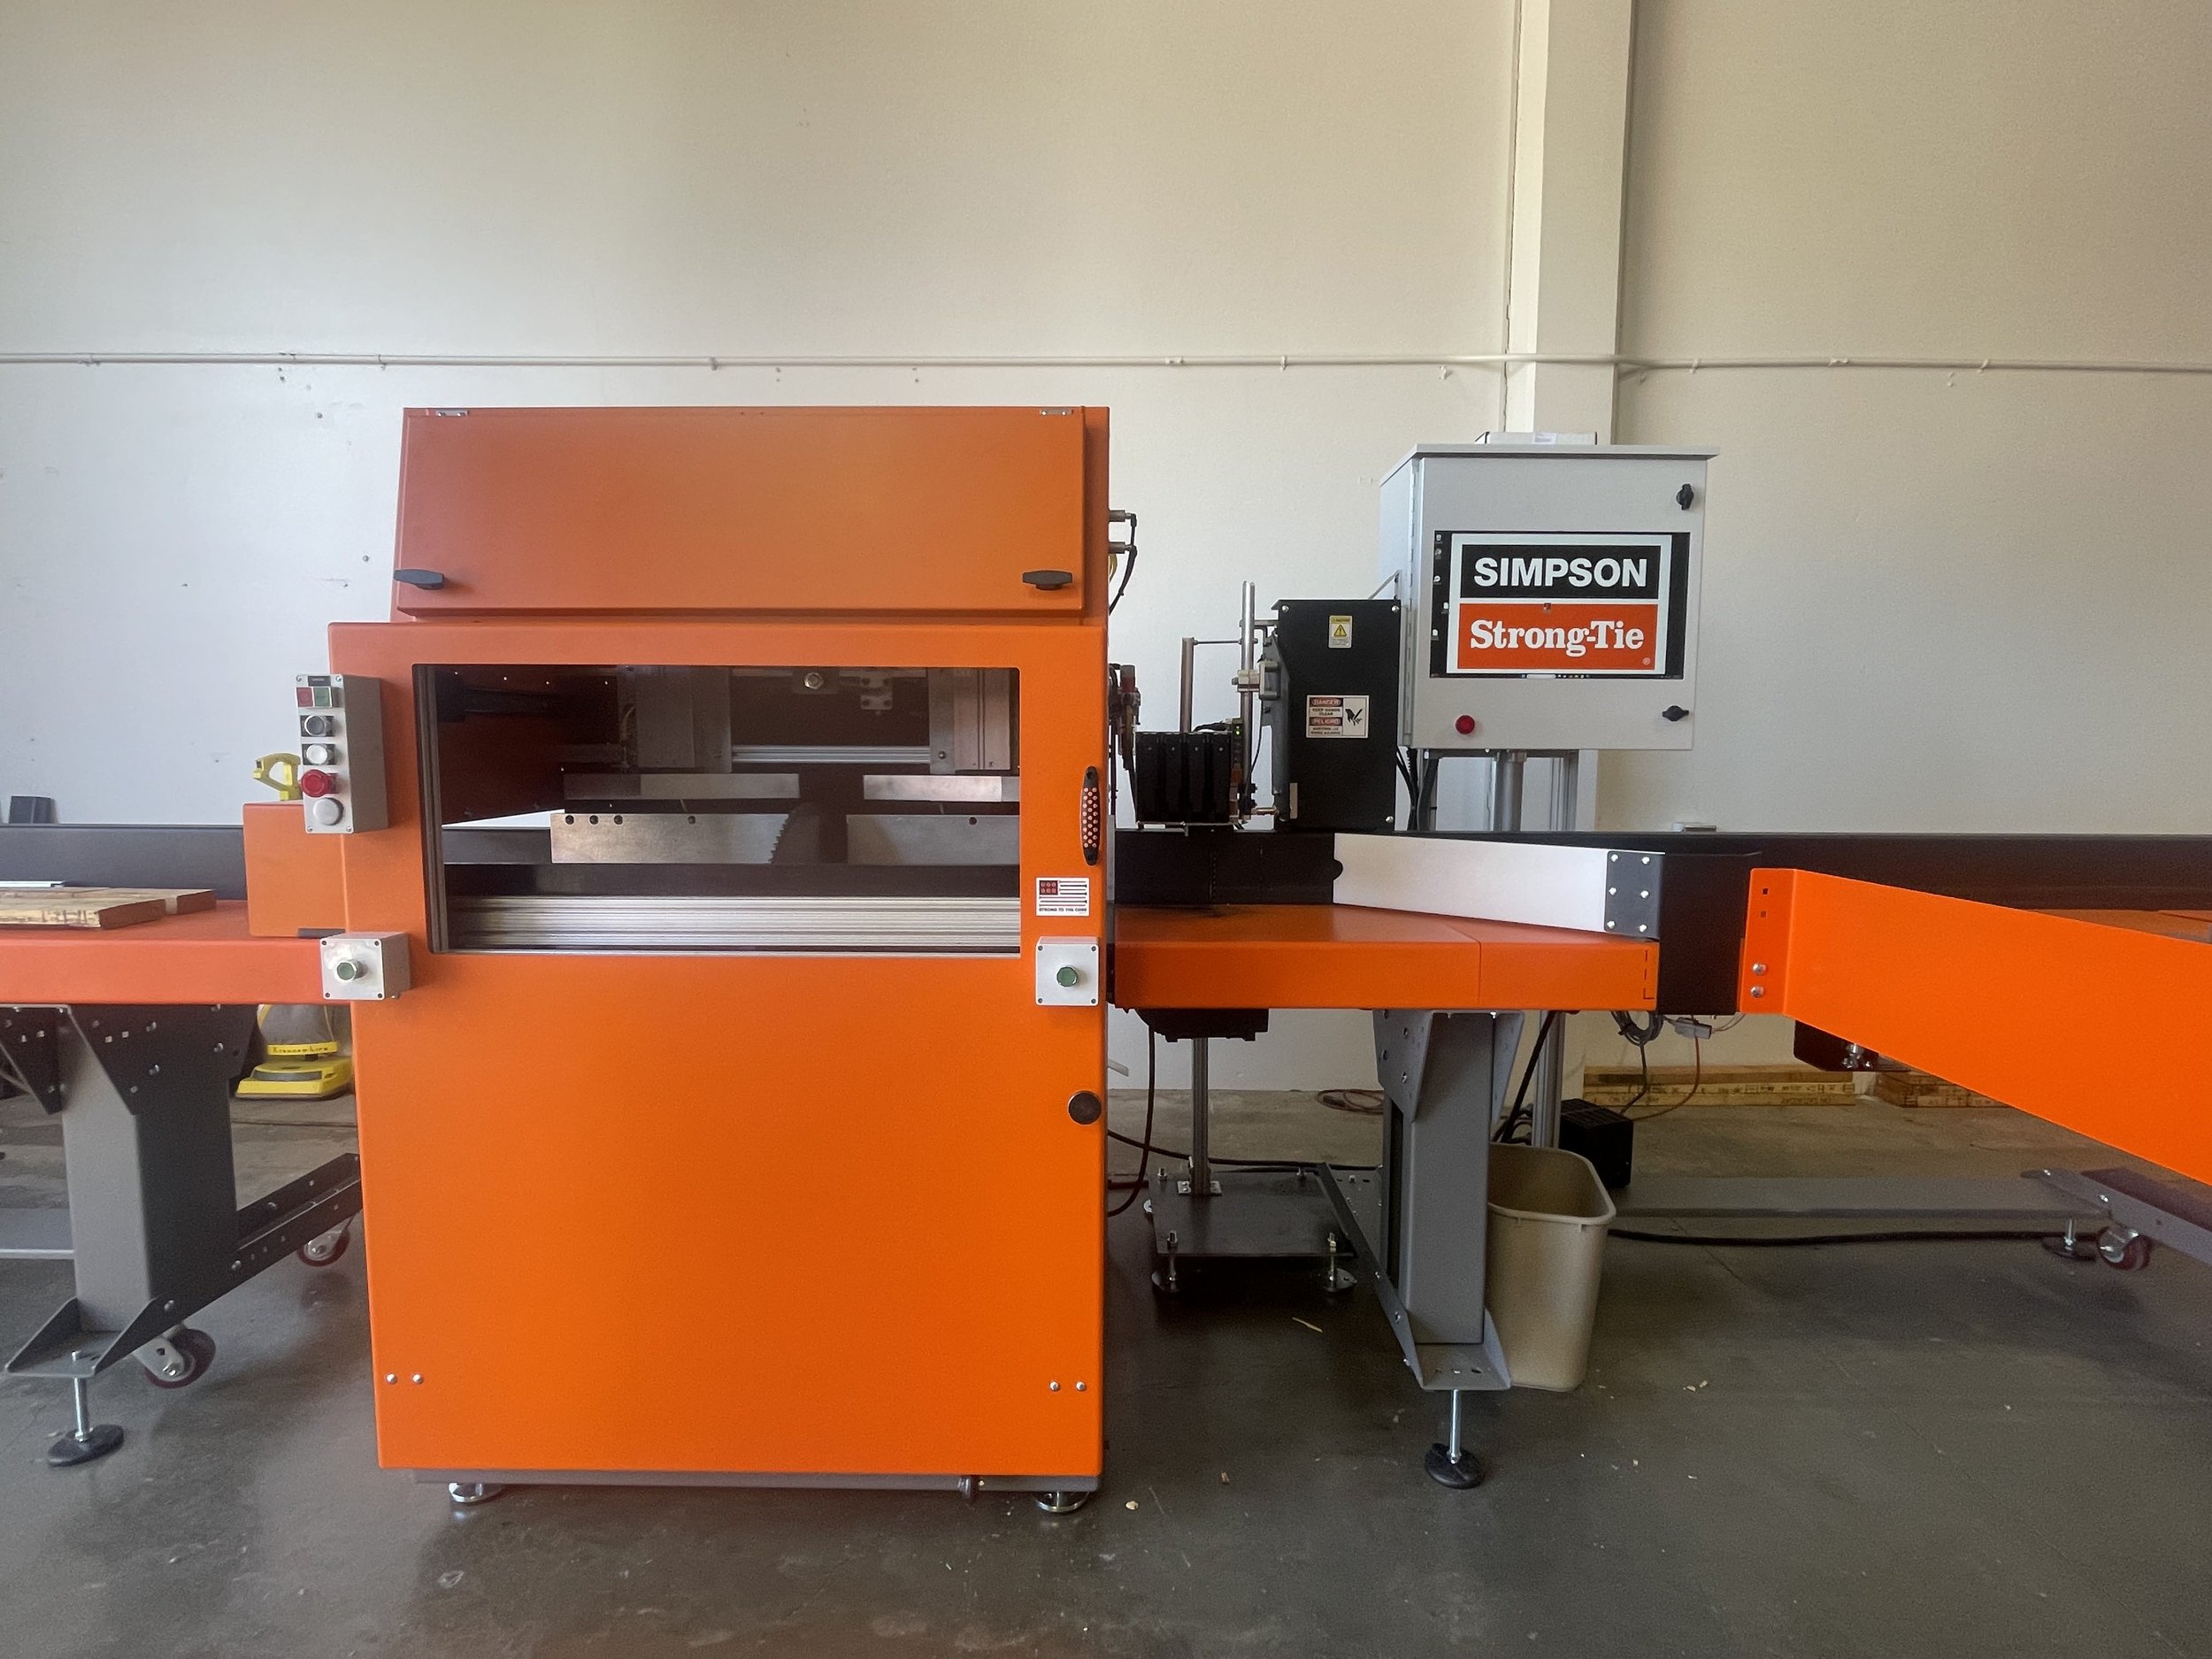
The EasyFrame Marking System
Now for the best part, producing your job. The EasyFrame Marking System can produce 12,000 BF per shift, printing up to 8” high utilizing a high end ink jet printer, and cutting up to 4x16, 6x14, or 8x8 lumber. The EasyFrame marking system also contains the market's most powerful linear optimizing algorithm and is designed to save the most wood possible.
Fully modular and fully customizable, the EasyFrame Marking System can be tailor-made to fit your production needs and budget.
EasyFrame Cloud Packaging and Building
(Optional)
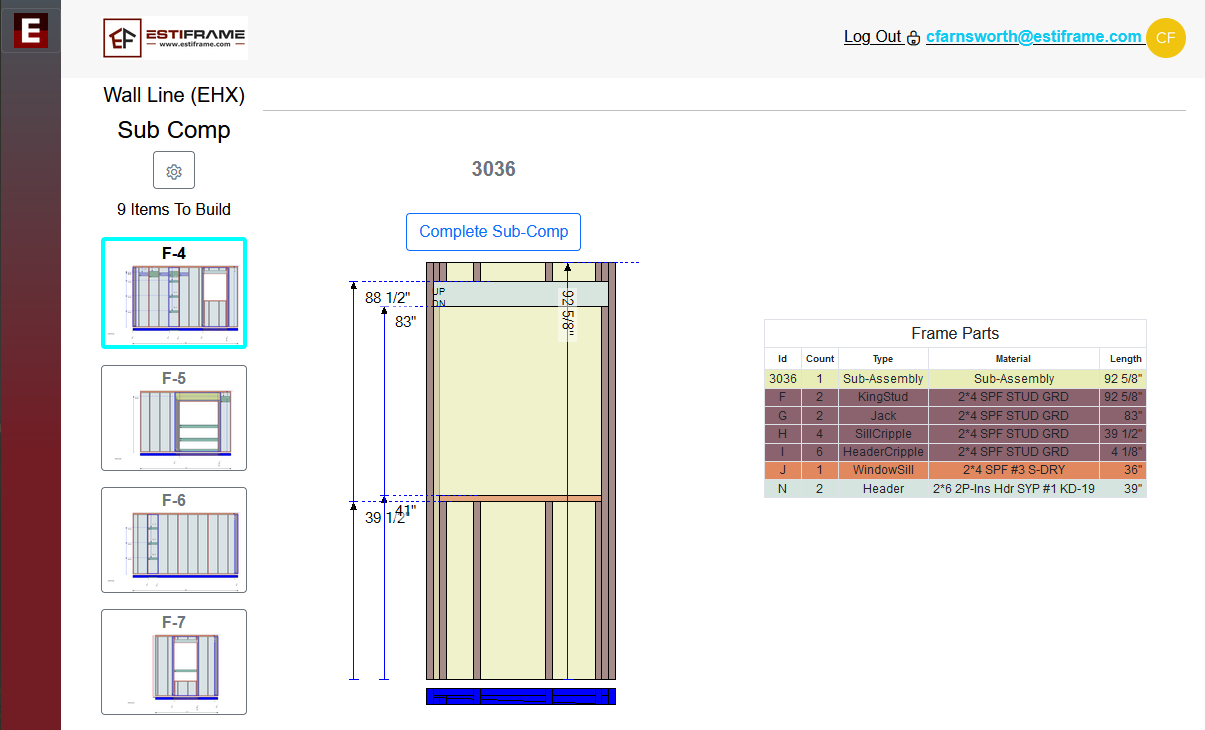
The last step is packaging and building. The EasyFrame Cloud can help with both providing customizable packaging list and customizable wall sheets.

EasyFrame Cloud Analytics
The last step is reviewing how well you have produced. The EasyFrame Cloud gives you the ability to view how much your EasyFrame saw, packaging lines, and building lines have produced. For example, you can view your Board Footage, Linear Footage, Waste, etc. You can also track the statuses of all your jobs, production speeds, and assembly lines.

